agriculture nature nature photography rural landscape food photography countryside farm life livestock rural life healthy eating
Sponsored Images iStock LIMITED DEAL:15% off with StockEditor15 coupon

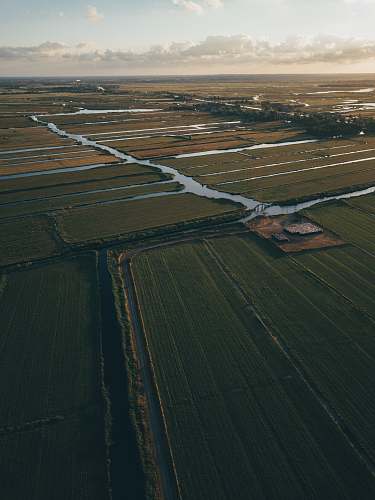
Aerial View of a Winding River in Lush Green Agricultural Fields

Golden Wheat Field Under Soft Focus

Black and White Ripe Pumpkins in Warehouse - Fall Harvest Imagery

Green Bean Field with Blossoming Leaves and Flowers

Vast Hay Field in Tranquil Prairie Landscape

Serene Sunset Over Rice Fields: Nature's Tranquil Canvas

Serene Dark Scene of Dairy Cows in Their Natural Habitat

Charming Cow Statue in Lush Pasture Field - Perfect for Wildlife and Farm Themes

Elegant White Cow with Black Background

Fresh Green Lettuce Growing in Rich Soil - Perfect for Food Photography

Scenic Windmill Landscape in a Lush Green Field

Tranquil Landscape with Dirt Road and Hay Bales Under a Vast Sky

Breathtaking Landscape of Hay Bales on a Tranquil Farm Field

Innovative Measurement: Corn Girth and Penis Size Contrast

Pumpkin Growing Amidst Fall Leaves on a Rustic Farm

Serene Meadow Scene with Grazing Cows in the Wildlife

Serene White Meadow with Grazing Cows in Lush Pasture

Serene Green Landscape with Cows in a Field of Flowers

Breathtaking Wheat Prairie Field Under a Clear Blue Sky

Aerial View of Autumn Agriculture with Pumpkin on Blue Background

Serene Pastoral Landscape with Grazing White Sheep on Lush Green Grass

Vineyard Landscape: Lush Green Fields Under the Sun

Historical Farmers Gathering in West Carlton, Oregon (1939)

Truck Loaded with Large Hay Bales - Free Stock Photo

Horse Grazing on Lush Green Grass - Stock Photo

Cereal Grasses and Grains Against a Blue Sky

Costa Rican Coffee Beans on Colorful Green Carpet

Grayscale Bull Statue: A Symbol of Strength and Resilience
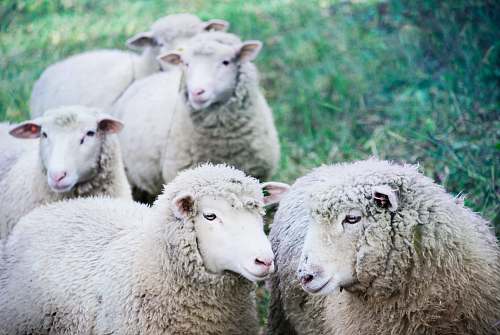
Serene Scene of Five White Sheep Grazing on Lush Green Pasture

Grayscale Portrait of a Grey Sheep in a Hayfield

Blossom Tractor in a Lush Tulip Field
Aerial View of Lush Green Grass Fields and Farm Landscapes
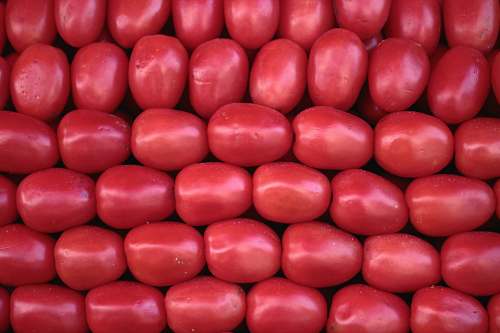
Close-Up of Fresh Red Tomatoes
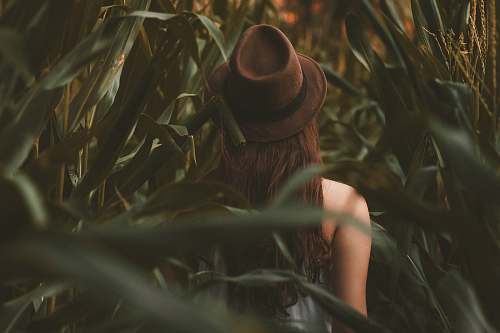
Woman Wearing a Hat in Lush Cornfield
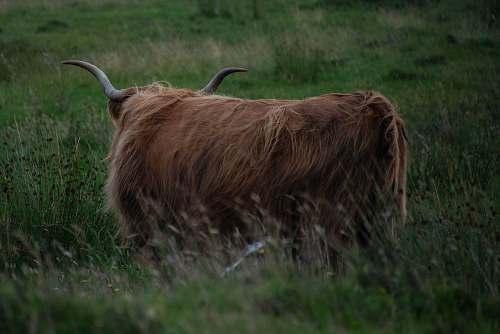
Serene Brown Yak Cow in Lush Green Grass Field
Serene Brown Cow Grazing in a Verdant Field
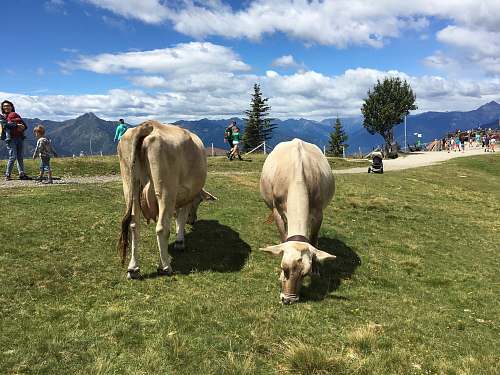
Breathtaking Brown Cattle Grazing in Mountainous Pastures
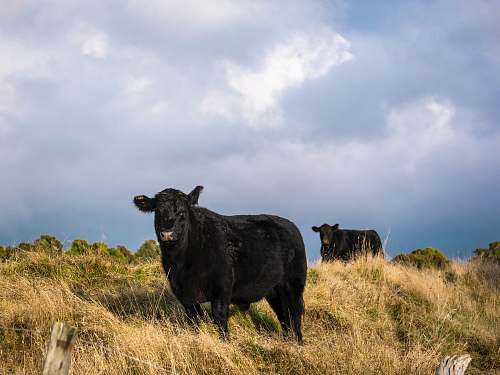
Black Cattle Grazing on a Sunny Hilltop
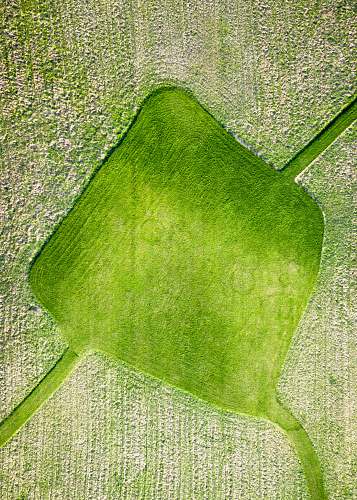
Intricate Plant Veins and Lush Green Squares in Nature
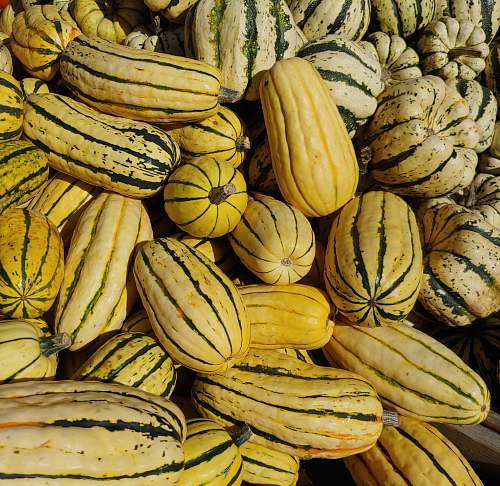
Yellow Squash and Bananas Pile - Fresh Farm Produce
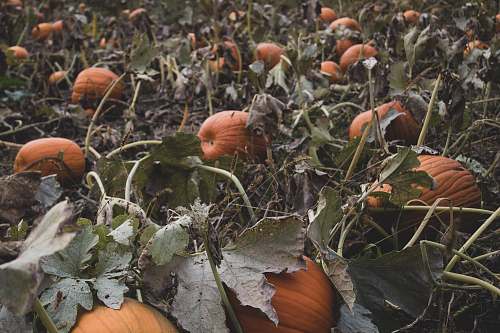
Field of Pumpkins: A Bountiful Squash Harvest
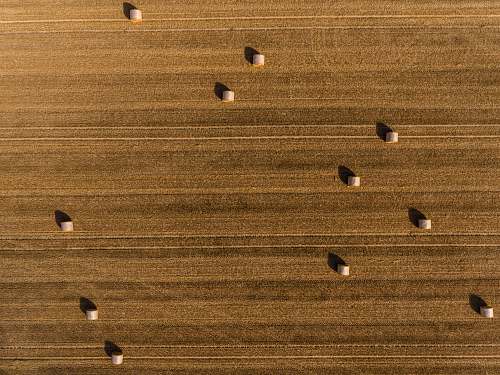
Aerial Drone Photography of Rustic Hay Bales and Wooden Boards
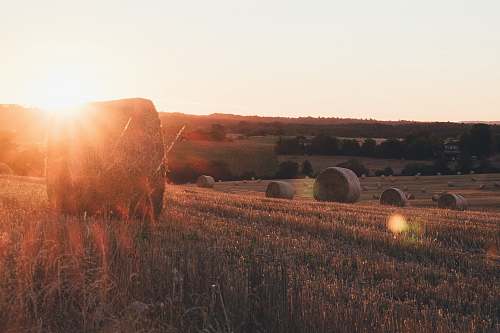
Serene Sunrise Over Lush Green Grass Fields with Hay Bales
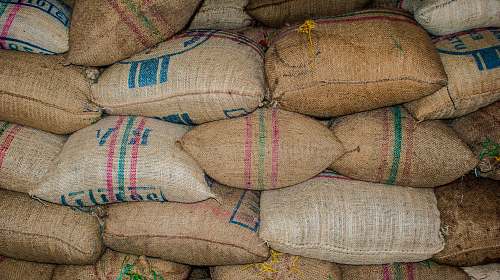
Brown Printed Rice Sacks for Sale at Kash City Market
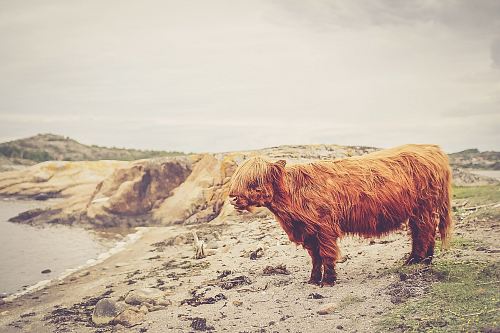
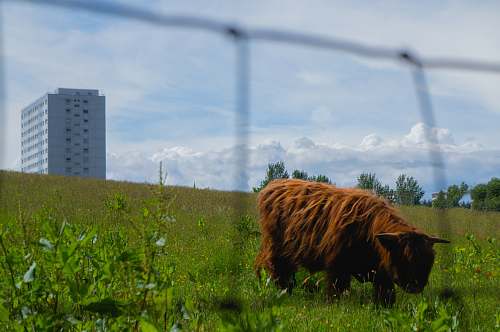
Serene Highland Cow Perched by Tranquil Waters
Check Also:
 15% OFF Exclusive Promo Code for Photos, Vectors and Video (Code: StockEditor15)


