technology data analysis analytics computer screen innovation charts business insights finance financial analysis
Sponsored Images iStock LIMITED DEAL:15% off with StockEditor15 coupon

Dynamic Holographic Stock Chart Dashboard on Computer Screen

Dynamic Holographic Stock Chart Dashboard Ascending

Finance Trading Visualization in Dark Room

NFT Ethereum Bar Chart Featuring the Number 3

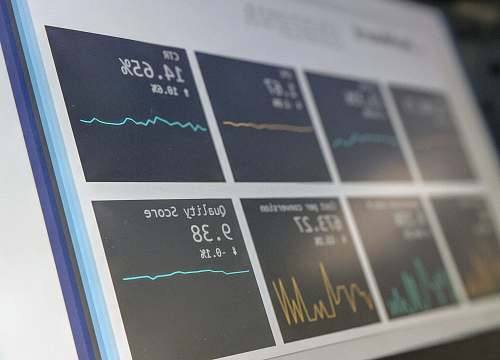
Dynamic Computer Screen with Graph Displaying Data Trends

Futuristic Tech Room with Data Visualization on Large Monitor

Innovative MacBook with Graph Visualization for Tech Insights

Business Insights: Professional Analyzing Data at Desk with Charts

Innovative Algorithm Infographics on Laptop Screen

Data Visualization Charts on Laptop with Notepad and Pen

Blue and Yellow Stroke Plot Diagram Artwork

Business Analyst Presenting Data Trends with Graphs

Man Analyzing Financial Data on Large Screen in Banking App Environment

Dynamic Business Analysis with Tablet and Pen on Desk

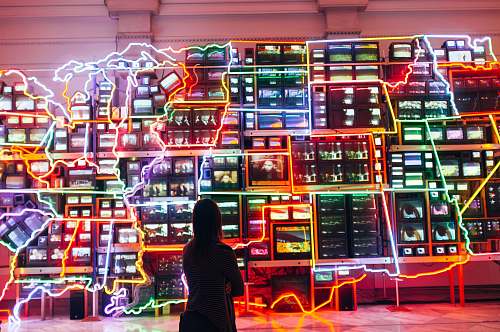
Smart City Transport: IoT Technology Visualized with World Map Connections

Illuminated Blue Globe with Circuit Lines in Digital Space

Businessman in Suit Analyzing Data with Red Circle on Glass

Businesswoman Analyzing Financial Data on Tablet

Business Analysis on Tablet: Charts and Audits in Focus

Minimalist White Computer with Traffic Statistics

Close-Up of a Person Holding a Black Samsung Smartphone Displaying Coronavirus Data

Advanced Space Center Technology - Dynamic Control Room with Multiple Monitors

Stock Market Trends Visualized on Tablet Screen

Dynamic Laptop Screen Displaying Analytics Graph

Woman in the Digital Matrix: Captivating Binary Code Illustration

Digital Map Displaying Germany's COVID-19 Case Statistics with National Flag

Innovative Smartphone Displaying Facebook and Bar Chart Insights
Data Analysis on Monitoring Screen with Graphs and Blackboards
Woman Analyzing Global Data on Monitors in Modern Office Decor

Impact of Coronavirus on America: A Computer Screen Visualization

US Census Data Visualization on Computer Screen

Black Flat Screen Monitor Displaying US Census Data
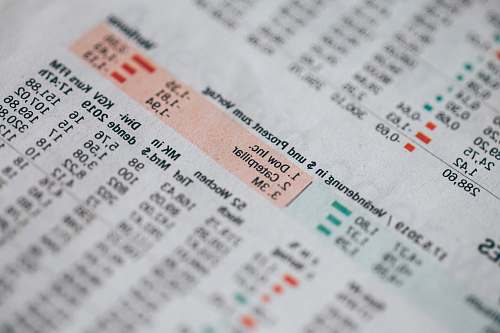
Financial Data Analysis: White Paper and Newspaper with Equity Metrics

Dynamic Code Visualization: Programming Languages on Computer Screen
Check Also:
 15% OFF Exclusive Promo Code for Photos, Vectors and Video (Code: StockEditor15)