
Our Photographer taken this photo with a camera and edit this with Adobe Photoshop 22.4 (Windows) and
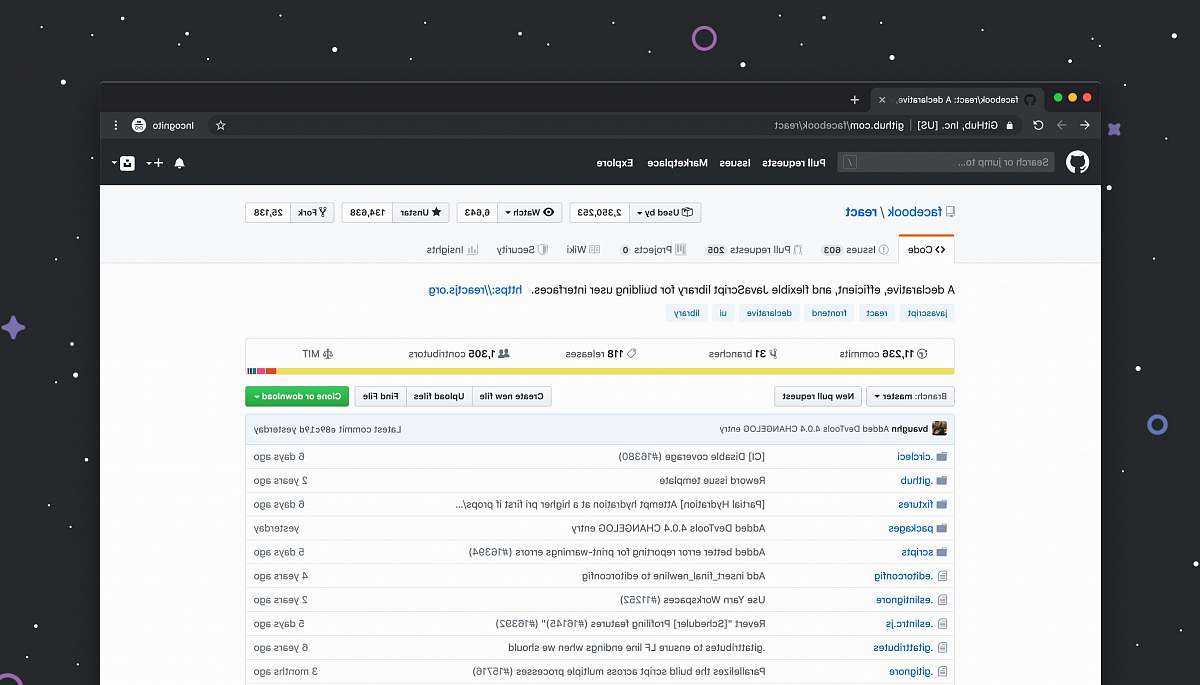
computer screen data graph business analytics financial report performance metrics data visualization technology presentation education digital designa computer screen with a graph on it
This vivid image captures a computer screen showcasing a detailed graph that illustrates various data trends. Ideal for use in business presentations, financial reports, or educational materials, this visual representation is perfect for illustrating analytics and performance metrics. The bright colors and clear design make it an excellent choice for professionals in the tech, finance, and marketing sectors looking to enhance their visual content.


All free photos on this site are public domain and free for commercial use. Please consider giving a credit to https://photostockeditor.com. It is not required but very much appreciated.
 15% OFF Exclusive Promo Code for Photos, Vectors and Video (Code: StockEditor15)